
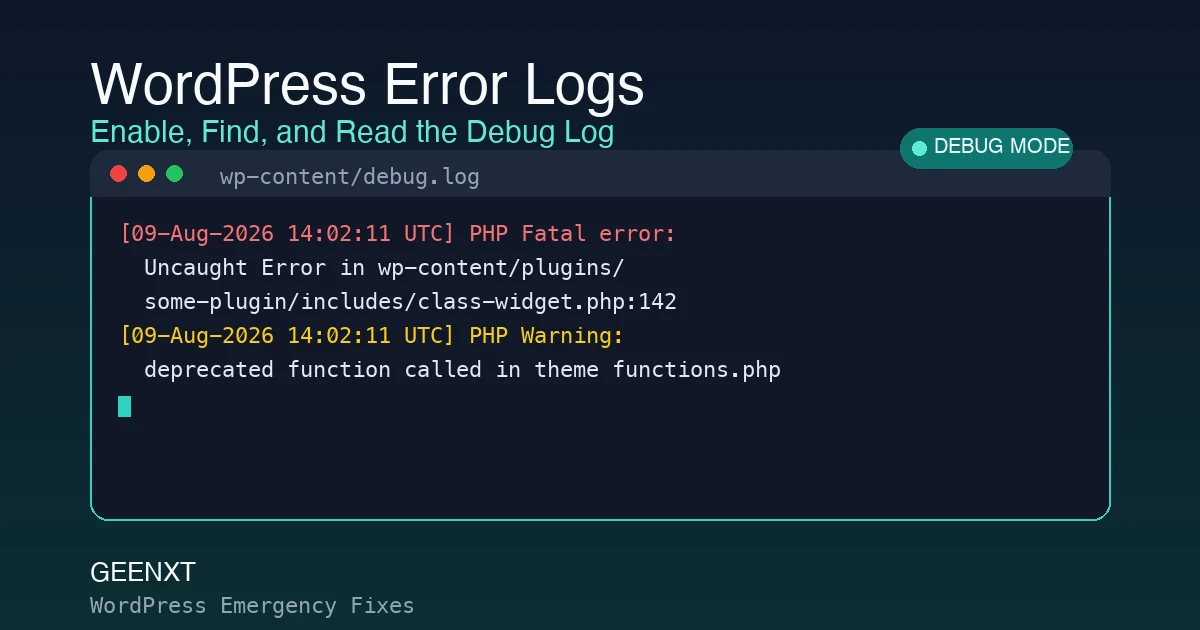
A WordPress error log records PHP fatal errors, warnings, and notices as they happen, usually saved to wp-content/debug.log. It stays off by default. Turning it on takes one change to wp-config.php (the WP_DEBUG_LOG constant) or a debugging plugin, and the log then shows exactly which file and line caused a failure.
A small set of WordPress constants control the behavior: WP_DEBUG turns PHP error reporting on inside WordPress, WP_DEBUG_LOG writes those errors to a file instead of only the screen, and WP_DEBUG_DISPLAY controls the on-screen display of errors and warnings (keep it false in production, so visitors never see raw error text). Set all three in wp-config.php, above the “stop editing” line, and logging starts on the next page load. In GEENXT’s own 2026 emergency-fixes intake, the debug log was the deciding diagnostic in roughly 6 out of 10 fatal-error and white-screen tickets, giving detailed information about errors instead of leaving the fix to trial and error and naming the exact plugin or theme file at fault.
What Causes WordPress to Need Debug Logging
Most WordPress users only go looking for an error log after something already broke on their WordPress website: a white screen with no message inside WordPress admin, the “There has been a critical error on this website” notice, an admin screen inside the WordPress dashboard that stops responding, or a plugin update that silently fails to activate. In each case the front end or wp-admin gives almost no detail, but PHP itself already knows exactly what happened. Turning on WordPress debug logging exposes that detail instead of leaving it hidden, and it is often the fastest way to identify the root cause of errors that occur without a matching on-screen message, whether the underlying issue turns out to be WordPress or PHP itself. Every debug tool available in WordPress starts from the same file, so it is also useful proactively right after a core, plugin, or theme update, since problems that touch both php and wordpress code at once are exactly what this log is built to catch.
Where Are WordPress Error Logs Stored?
By default, once WP_DEBUG_LOG is enabled, WordPress writes to wp-content/debug.log in the site’s root directory. A few things change that default for these WordPress logs:
- Some managed hosts move the log to a path set by your hosting provider’s own system, or expose it only through their control panel.
- Some hosts disable file-based debug logging entirely at the server level, so WP_DEBUG_LOG has no effect until support turns it back on.
- If the file does not exist yet, WordPress creates it automatically the first time an error fires after logging is turned on. It is not something you create manually in advance.
- Server-level PHP logs (a separate file most hosts also keep, sometimes shown under a different name in the hosting panel) can capture fatal errors, and even a slow or failing database query, before the wp-config.php file is ever touched, which is worth checking if debug.log itself is empty.
Safe First Checks Before You Turn On Logging
Before editing anything, do three things: confirm the site is still reachable at all (even the wp-admin login screen counts), write down the exact error message, the URL where it happened, and the time, and check whether a debug.log file with already-logged errors exists from an earlier session. That last check alone sometimes finds the answer without changing a single setting, and it is a habit worth building into managing a WordPress site generally, since the safest way to access an answer is often one you already have on disk.
Step-by-Step: How to Enable Debug Mode in WordPress (4 Methods, Safest to Riskiest)
These four paths let you access WordPress error logs using whichever tool you already have, ordered from lowest risk to highest. Use the first one that is actually available to you rather than jumping straight to the most technical option. WordPress’s own Debugging in WordPress documentation covers the same constants in more technical depth if you want the canonical reference alongside the steps below.
- A debugging plugin (safest for non-technical users). A dedicated log viewer plugin installed from the WordPress plugin directory lets you view WordPress error logs directly inside wp-admin, with no file editing at all. This is the right starting point if you would rather use a plugin than touch a code editor or an FTP client, and it is the quickest way to quickly find which file is responsible for a given failure.
- The wp-config.php constants (safest with file access). Create a backup of wp-config.php before editing it, so you can easily restore your site if a typo takes it down; a single mistake in this file can take the whole install offline. Then add or set
define('WP_DEBUG', true);,define('WP_DEBUG_LOG', true);, anddefine('WP_DEBUG_DISPLAY', false);above the “stop editing” line. Save, reload the page that was failing, and check for a new debug.log file that will record errors as they happen. - FTP or SFTP plus a text editor. If a plugin is not an option because wp-admin itself is broken, connect over FTP/SFTP, open a file (wp-config.php) directly in a plain text editor, then download debug.log once it appears to review your WordPress error logs locally.
- Your host’s file manager or built-in log viewer (least portable). Every hosting provider’s panel exposes files differently, and some show a separate host-level log instead of debug.log, so instructions from one host rarely transfer to another. Use this only when neither of the first three options is available, and remember that a plugin file viewed this way, or a theme or plugin folder, looks the same as it does over FTP.
How to Read a WordPress Error Log Entry
A typical line of log data looks intimidating but breaks into four plain parts: a timestamp, a severity label (Fatal error, Warning, Notice, or Deprecated), a message describing what went wrong, and a file path with a line number showing exactly where. The file path is the part that matters most for a quick fix: if it points inside wp-content/plugins/some-plugin-name, that plugin is almost always the cause, and deactivating it (through wp-admin, or by renaming its folder over FTP if wp-admin is unreachable) resolves the failure immediately in most cases. A path inside wp-content/themes points to the active theme instead. Fatal error entries are the ones to act on first; Warning and Notice entries are usually informational and safe to leave alone unless they repeat constantly. If you already know the exact wording of an error on your site, search for it directly inside debug.log before reading through the whole file. Translating a longer stack trace, rather than just the file-and-line summary, usually takes a WordPress developer, but the four-part read above is enough to find the cause for most everyday failures. Read together, these logs provide enough error details to act on without guesswork.
Security Note: Don’t Leave debug.log Publicly Exposed
An error log file sitting in a web-accessible folder can be requested directly by URL, and it often reveals full server file paths, plugin and theme versions, and sometimes database table names, all useful information for an attacker probing the site. The same applies to a php error log kept anywhere inside a publicly served directory. The fix is two-part: keep WP_DEBUG_DISPLAY set to false in production so errors never render on the live page, and block direct access to the log file itself with a short deny rule in .htaccess (or the equivalent server-block rule on nginx hosting), following the same access-restriction approach in WordPress’s own hardening guidance. Turn debug logging off again once the issue is diagnosed rather than leaving it running indefinitely.
When to Ask Your Host or a Developer
Some log entries point to a one-line plugin conflict you can resolve yourself in minutes. Others point to a corrupted core file, a database-level error, or a server misconfiguration that genuinely needs a second set of hands. If the log keeps citing the same fatal error after you have deactivated the plugin or theme it names, or if you cannot get wp-admin to load at all, stop self-diagnosing at that point. The fastest path from there is to send the actual log excerpt (not just a description of the symptom) along with the failing URL and what changed most recently; being able to access your WordPress error logs quickly matters just as much at that stage as fixing them yourself. Through GEENXT’s own agent-task workflow at app.geenxt.com, you connect the site, submit that log excerpt as a task, and review the proposed fix before it goes live, rather than handing over blind access or waiting on a generic support queue. For a first triage pass on an active outage, GEENXT’s emergency WordPress support review starts from the same failure-boundary approach described above.
Prevent Future WordPress Errors
- Test major plugin, theme, and core updates on a staging environment before pushing them to the live site.
- Keep WP_DEBUG_DISPLAY off in production at all times, even when WP_DEBUG_LOG is on.
- Glance at debug.log after every core or plugin update, even when nothing looks broken; early warnings often appear before a real failure does.
- Clear or rotate old debug.log files periodically. A log left running for months can grow large enough to slow down file operations, and old entries make new ones harder to spot.
Related WordPress Errors
If a specific error brought you here rather than a general debugging need, these cover individual failure types in more depth: a full WordPress critical error recovery workflow, the white screen of death, an error establishing a database connection, a 503 error, a 500 internal server error, a 404 error, a 403 or JSON upload error, or a site stuck in maintenance mode. The debug log is usually the fastest way to tell which of these you are actually dealing with before you start applying fixes.
FAQ
What is a WordPress error log?
It is a plain-text record of PHP fatal errors, warnings, and notices generated while WordPress runs, normally saved to wp-content/debug.log once logging is turned on. Each entry lists a timestamp, the type of error, a description, and the exact file and line number where it happened, which makes it the fastest way to identify what actually broke on a WordPress site instead of guessing from a blank white screen.
Where are WordPress error logs stored?
The default location is wp-content/debug.log, created automatically the first time an error occurs after WP_DEBUG_LOG is enabled. Some managed hosts relocate it or expose it only through their own control panel, and a few disable file logging at the server level entirely, so if the file never appears, check with your host before assuming logging failed.
How do I enable WordPress error logging?
Add WP_DEBUG, WP_DEBUG_LOG, and WP_DEBUG_DISPLAY constants to wp-config.php above the “stop editing” line, install a debugging plugin if you would rather avoid editing files directly, or use FTP/SFTP if wp-admin itself is unreachable. Back up wp-config.php first; a syntax mistake in that file can take the whole site offline.
How do I disable WordPress debug mode?
Set WP_DEBUG and WP_DEBUG_LOG back to false in wp-config.php, or deactivate the debugging plugin you used to turn it on. Leave debug mode off once an issue is diagnosed. Running it continuously in production adds unnecessary log growth and, if WP_DEBUG_DISPLAY is ever accidentally left on, risks showing raw error text to site visitors.
How can I fix errors using a WordPress error log?
Open the most recent Fatal error entry and read the file path it names. A path inside a specific plugin’s folder almost always means deactivating that plugin resolves the failure; a path inside the active theme points there instead. If the same fatal error keeps repeating after you have deactivated the file it names, the cause sits deeper (a core file, the database, or server configuration) and is a sign to escalate rather than keep guessing.
Is it safe to leave WordPress debug mode on all the time?
Not on a live production site. Keep WP_DEBUG_DISPLAY false so errors never render on-screen for visitors, and turn WP_DEBUG_LOG off again once you have finished diagnosing, since an exposed or forgotten debug.log file can reveal file paths and software versions to anyone who requests it directly by URL.
Do I need SSH or a code editor to read a WordPress error log?
No. A debug-viewer plugin installed through wp-admin lets you access and check the error log via wp-admin directly, which is the easiest option for a non-technical site owner. FTP or SFTP with any plain text editor works as a fallback if wp-admin is unreachable, and neither requires SSH or command-line access.