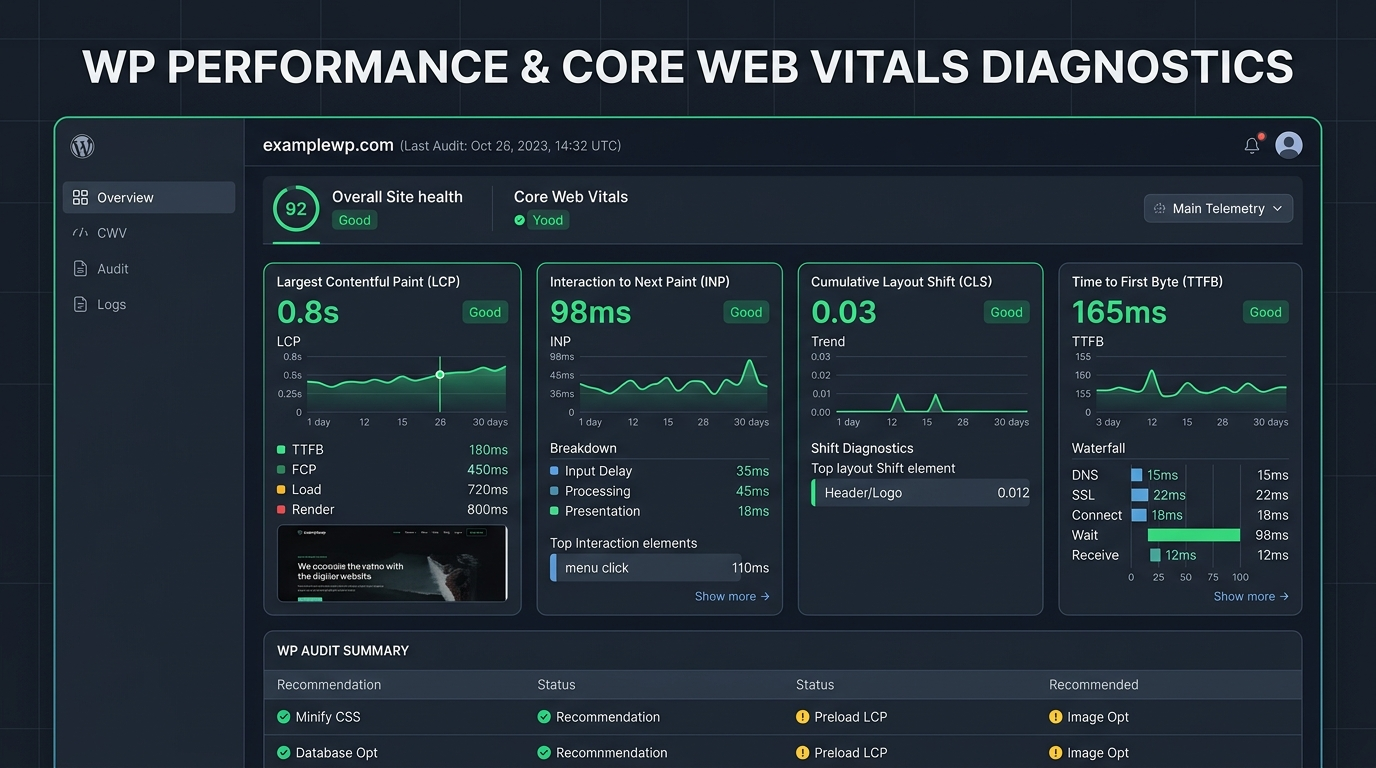
Direct answer: A WordPress performance audit is a systematic evaluation of server response latency, database queries, code execution, and front-end assets to discover why a site feels slow or fails Core Web Vitals. Unlike a single-click synthetic test, a complete audit diagnoses five core areas: server infrastructure and Time to First Byte (TTFB), real-user Core Web Vitals field data (LCP, INP, CLS), network waterfall execution, database query latency, and media delivery pipelines. It produces an executive summary, an engineering action matrix, and a prioritized fix roadmap.
Most website owners evaluate speed by testing their URL in Google PageSpeed Insights, checking the score circle, and feeling either relieved or frustrated. When the score is red, the typical response is to install an optimization plugin, turn on minification, and hope the number turns green. In many cases, the score barely changes, or worse, critical features like mobile menus and checkout buttons break.
Over ten years of hands-on WordPress development, I have audited hundreds of slow websites. Performance optimization is a diagnosis problem, not a plugin race. Installing plugins without understanding latency origins is like replacing engine parts without opening the hood. You spend hours adjusting toggles while the real bottleneck remains untouched.
In this guide, we walk through how to conduct a comprehensive wordpress performance audit. We cover why synthetic tests mislead site owners, explore five core technical pillars, examine essential deliverables, and provide a checklist table you can use immediately. Whether you manage an in-house team or work with our dedicated WordPress support plans, this framework replaces guesswork with verifiable data.
Why Single-Score Lighthouse Tests Mislead Website Owners
Automated auditing tools like Google Lighthouse and PageSpeed Insights are helpful for quick checks, but relying strictly on their scores creates two common pitfalls.
1. Lab Data Does Not Match Real User Experience
Lighthouse runs in a simulated lab setting. It loads a page under artificial network throttling, simulating a mid-tier phone on a slow connection from a single server location. This simulation is useful for debugging, but it does not reflect the conditions of your real audience.
Google assesses page experience using field data from real visitors via the Chrome User Experience Report (CrUX). A website might score 65 in a lab test due to marketing tags, yet pass all Core Web Vitals thresholds for 90% of actual visitors. Conversely, a staging site might score 98 in the lab, yet stall in production when unindexed database queries collide under traffic.
2. Single Scores Conceal Root Causes
A score of 45 does not show what to fix first. It does not clarify whether delays stem from slow database queries, oversized images, render-blocking stylesheets, or long JavaScript execution tasks. To resolve latency, you must inspect the network waterfall. A waterfall chart maps the chronological sequence of every asset: DNS lookups, TLS handshakes, server processing, downloads, and browser rendering.
Through a structured core web vitals audit wordpress workflow, you move past vanity scores to identify exact milliseconds lost across the page lifecycle.
The 5 Core Pillars of a True WordPress Performance Audit
A complete WordPress audit investigates five technical layers. Overlooking any single layer leaves major performance gains on the table.
1. Server Infrastructure and Time to First Byte (TTFB)
Time to First Byte measures the delay between a browser page request and receiving the initial byte from the server. If your host takes 1.8 seconds just to deliver the initial HTML document, your page cannot achieve Google’s 2.5-second Largest Contentful Paint target.
When reviewing server latency and planning ttfb optimization wordpress routines, audit these key factors:
- Hosting Resources: Shared environments often throttle CPU and memory during peak traffic. Confirm whether the server provides dedicated CPU cores and fast NVMe storage.
- PHP Version: Sites running modern PHP versions (such as PHP 8.2 or 8.3) execute requests up to 25% faster than older PHP 7.4 setups.
- PHP Worker Concurrency: Dynamic requests (shopping carts, checkout sessions, and search filters) bypass page caches and consume PHP workers. When worker limits are hit, visitors queue, creating severe TTFB spikes.
- Persistent Object Caching: Without in-memory object caching via Redis or Memcached, WordPress queries the database repeatedly for identical transients and site options on every request.
- Modern Protocols: Verify HTTP/2 or HTTP/3 support to enable multiplexed asset streaming over a single connection.
- Global TTFB: Measure response times globally. An origin server in Texas might deliver a 250ms TTFB domestically, but take 1,200ms in Europe or Asia without edge caching.
For more on infrastructure tuning, review our specialized website performance services.
2. Core Web Vitals Field Data (Real-User Metrics)
Google evaluates web performance through three Core Web Vitals metrics at the 75th percentile of real visits over a rolling 28-day window:
- Largest Contentful Paint (LCP): Tracks when the main content element renders in the viewport. The benchmark is under 2.5 seconds. Slow LCP is commonly caused by delayed TTFB, lazy-loaded hero banners, missing image dimensions, or render-blocking fonts.
- Interaction to Next Paint (INP): Measures interface responsiveness during user interactions (clicks, taps, keypresses). The threshold is under 200 milliseconds. High INP usually indicates heavy JavaScript tasks blocking the main browser thread.
- Cumulative Layout Shift (CLS): Measures visual stability during loading. The target threshold is 0.1 or lower. Common culprits include dynamically injected ads, web fonts swapping without size matching, and images missing explicit width and height attributes.
Reviewing mobile field data separately from desktop in Search Console is essential, as mobile visitors face weaker mobile processors and fluctuating network speeds.
3. Asset and Script Execution Waterfall
The network waterfall details how browsers discover, download, and execute styles, scripts, fonts, and images. During this stage, inspect:
- Render-Blocking Resources: Stylesheets and scripts loaded synchronously in
<head>halt browser rendering until download and execution finish. Stylesheets should be minified, and non-critical scripts deferred. - Unused Code: Complex themes and page builders often load complete script bundles on pages that use only a fraction of their features. DevTools Coverage reveals bundles where over 70% of code goes unused.
- Third-Party Tag Delays: Analytics tags, pixels, heatmaps, and chat widgets add substantial overhead. Each external service demands DNS lookups, SSL handshakes, and execution time. Catalog all tags to delay or remove unnecessary trackers.
- Plugin Execution Overhead: Tools like Query Monitor identify plugins adding hundreds of milliseconds of server processing time to every page load.
4. Database Health and Query Latency
On dynamic websites and WooCommerce stores, database latency is frequently the hidden speed killer. Every dynamic visit queries MySQL for post data, metadata, cart items, and settings.
A database audit investigates:
- Autoloaded Options: The
wp_optionstable loads rows markedautoload = 'yes'into memory on every request. Keep autoloaded data under 800 KB (ideally under 500 KB). Abandoned plugins frequently leave megabytes of old options in memory. - Slow Queries: Profile queries exceeding 50ms. Complex joins and unindexed
postmetalookups bypass indexes and trigger slow full-table scans. - Revisions and Transients: Thousands of post revisions, spam records, and expired transients bloat table indexes, degrading query speed over time.
- Storage Engine: Ensure tables use InnoDB rather than legacy MyISAM tables that lock entirely during write operations.
5. Media and Asset Delivery Pipeline
Media files represent the bulk of page weight on modern sites. Even fast hosting cannot offset an uncompressed 4 MB hero banner on mobile.
The media review examines:
- Next-Gen Formats: Serve images in WebP or AVIF formats, reducing file weight by 30% to 50% compared to legacy JPEG and PNG formats without visual degradation.
- Responsive Images: Ensure themes generate proper
srcsetattributes so mobile phones do not fetch full-size desktop graphics. - Hero Image Priority: Never lazy-load the above-the-fold hero image. Preload it with
fetchpriority="high"and apply native lazy loading only to below-the-fold images. - Self-Hosted Fonts: Loading fonts from third-party servers adds connection delays. Host WOFF2 files locally, preload key font families, and set
font-display: swap. - CDN Edge Caching: Distribute static assets across global edge servers to reduce latency and origin server load.
For hands-on remediation steps across these areas, explore our detailed guide on WordPress performance optimization.
Deliverables Breakdown: What You Should Actually Receive
An audit should provide clear engineering guidance rather than an automated scan export. A professional review provides concrete website speed audit deliverables across three documents.
1. Executive Summary
Written for business leaders and marketing managers, this summary highlights:
- Current Core Web Vitals status across mobile and desktop.
- Direct business and conversion risks tied to identified latency.
- Key bottlenecks restricting site speed.
- Recommended engineering scope and priority order.
2. Technical Action Matrix
The working blueprint for developers lists each issue across hosting, code, database, and media:
- Observed Issue: Clear diagnostic findings (such as 3 MB of autoloaded options or 500ms of unoptimized tracking scripts).
- Affected Templates: Where the bottleneck occurs across page types.
- Severity: Categorized as Critical, Moderate, or Minor based on Core Web Vitals impact.
- Estimated Effort: Engineering hours required to fix and test on staging.
- Technical Fix: Step-by-step instructions to eliminate the root cause.
3. Priority Fix Roadmap
To reduce operational risk, remediation is sequenced into three stages:
- Phase 1: Quick Wins (Days 1 to 3): Low-risk adjustments including image conversions, removing unused plugins, and basic page caching.
- Phase 2: Code and Asset Tuning (Weeks 1 to 2): Deferring non-critical scripts, preloading critical fonts, self-hosting trackers, and clearing autoloaded options.
- Phase 3: Architectural Upgrades (Month 1): Structural improvements tested in staging, including PHP upgrades, Redis caching, or hosting migrations.
To see how ongoing performance tracking is documented in monthly client reports, review our WordPress maintenance report example.
Plain-English Walkthrough: How Non-Technical Stakeholders Should Interpret Audit Findings
Business owners do not need to read database query logs to make sound decisions. Focus on three practical principles:
1. Separate Server Delays from Front-End Delays
Determine whether your website is slow before the browser receives HTML (server TTFB) or during rendering (front-end assets). Server delays point to hosting, PHP, and database cleanup. Front-end delays point to images, fonts, and JavaScript optimization.
2. Audit Third-Party Marketing Tags
Marketing pixels and chat widgets often drive over half of total JavaScript execution time. If your team has not reviewed a marketing tag in three months, removing it gives an immediate speed boost at zero development cost.
3. Focus on Revenue Pages First
Chasing 100/100 across every URL is rarely a smart business investment. Focus engineering effort where revenue happens: homepages, service landing pages, product pages, and checkout flows.
The Complete WordPress Performance Checklist
Use this actionable wordpress performance checklist during your audit to systematically inspect each performance layer.
| Audit Area | Specific Check | Diagnostic Tool | Target Benchmark | Actionable Fix |
|---|---|---|---|---|
| Server / TTFB | HTML response latency | WebPageTest / KeyCDN | Under 600ms globally | Enable page caching, tune PHP workers, upgrade hosting |
| Server / PHP | PHP runtime version | WordPress Site Health | PHP 8.2 or 8.3 active | Verify plugin compatibility on staging; update PHP |
| Object Cache | Persistent memory cache | Query Monitor / WP-CLI | Redis or Memcached active | Install and configure Redis object cache |
| Core Web Vitals | Largest Contentful Paint (LCP) | CrUX / Search Console | Under 2.5s (75th percentile) | Preload hero image, self-host fonts, reduce TTFB |
| Core Web Vitals | Interaction to Next Paint (INP) | DevTools Performance panel | Under 200ms | Split long tasks, defer non-critical JavaScript |
| Core Web Vitals | Cumulative Layout Shift (CLS) | DevTools Layout Shift view | Under 0.1 | Set explicit image dimensions; reserve container space |
| Assets / CSS | Render-blocking styles | PageSpeed Insights | Zero blocking head CSS | Inline critical CSS; defer secondary styles |
| Assets / JS | Unused JavaScript weight | DevTools Coverage tab | Under 150 KB unused code | Dequeue unused assets; apply defer/async tags |
| Third Parties | External script latency | WebPageTest Domains | Under 300ms blocking time | Consolidate marketing pixels; delay non-critical scripts |
| Database | Autoloaded options size | phpMyAdmin / WP-CLI | Under 800 KB total size | Clean orphaned transients; set autoload to ‘no’ on large rows |
| Database | Slow query execution | Query Monitor plugin | 0 queries exceeding 50ms | Add indexes to meta queries; clear old post revisions |
| Media Delivery | Image format and size | Squoosh / PageSpeed | Next-gen WebP or AVIF | Compress media automatically; verify responsive tags |
| Fonts | Font delivery strategy | Network panel (Fonts) | Local WOFF2 preloaded | Host fonts locally; add font-display: swap in CSS |
| Edge Caching | CDN asset distribution | Response headers (CF-Cache) | Edge cache HIT on static files | Set CDN caching rules; activate edge page caching |
How GEENXT Diagnoses and Solves WordPress Performance Bottlenecks
At GEENXT, we approach WordPress performance as senior software engineers rather than plugin installers. We identify root causes across code, databases, and hosting infrastructure.
Every site we support benefits from over ten years of technical troubleshooting and more than 10,600 billed hours with international clients. We offer structured monthly plans to keep websites fast and stable:
- Care Plan ($49/month): Fundamental protection including cloud backups, security hardening, uptime monitoring, and controlled updates tested before deployment.
- Professional Plan ($99/month): Performance and technical support including regular Core Web Vitals audits, database hygiene routines, staging workflows, and developer assistance.
- Premium Plan ($499/month): Advanced architectural maintenance for high-traffic and WooCommerce sites, including code profiling, query indexing, checkout tuning, and priority support.
All GEENXT plans feature under 24-hour turnaround on technical requests, month-to-month terms without lock-in contracts, cancel anytime flexibility, and a 7-day money-back guarantee. If your site is sluggish or failing Google Core Web Vitals, explore our WordPress maintenance and support plans or contact us today to schedule a comprehensive audit.
Frequently Asked Questions
How often should a business run a WordPress performance audit?
Most commercial websites should conduct an audit quarterly, or before major redesigns, theme updates, and marketing pushes to catch regressions early.
What is the difference between a speed test and a performance audit?
A speed test is an automated tool scan that produces a single score and generic tips in a few seconds. A performance audit is an in-depth technical investigation analyzing server logs, database queries, real-user Core Web Vitals, and code execution to produce a prioritized roadmap.
Can a caching plugin fix all WordPress performance issues?
No. A caching plugin serves static HTML to guests, improving TTFB for cached visits. It cannot fix slow database queries on dynamic pages (such as shopping carts), heavy JavaScript execution, or third-party marketing tag delays.
How long does a typical WordPress performance audit take to complete?
A thorough technical audit takes two to four business days. This allows sufficient time to gather representative field data, profile database queries, analyze waterfalls, and develop an actionable engineering plan.
Reviewed by: Mark Anthony Garcia, GEENXT WordPress Support.